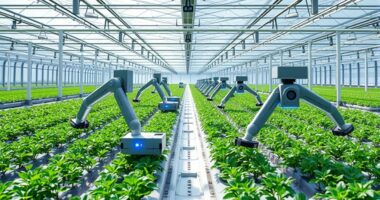

Automated climate data logging systems continuously capture environmental data with high accuracy, helping you monitor conditions like temperature, humidity, and more. These systems often include calibration tools to guarantee measurement accuracy over time, and visualization features to make sense of complex data quickly. With real-time insights, you can respond swiftly to environmental changes and make informed decisions. Keep exploring to discover how integrating these tools can enhance your climate management practices seamlessly.
Key Takeaways
- Automated data logging captures continuous environmental measurements, ensuring comprehensive and real-time climate data collection.
- Calibration integration maintains sensor accuracy, reducing errors and enhancing data reliability over time.
- Visualization tools convert raw data into intuitive charts and maps, aiding quick interpretation of climate trends and anomalies.
- System features like dashboards enable prompt decision-making and efficient response to environmental changes.
- Automated interpretation combines calibrated data and visual insights to support sustainable practices and informed environmental management.

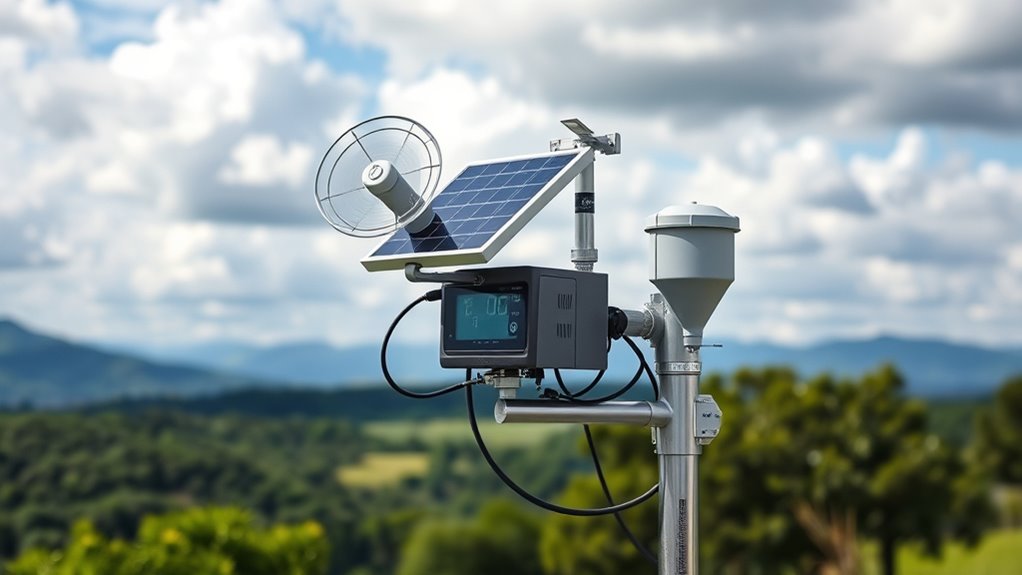
Automated climate data logging has revolutionized how we monitor environmental conditions. With advanced sensors collecting real-time data, you gain a clearer picture of weather patterns, temperature fluctuations, humidity levels, and more. But to guarantee the accuracy of this data, sensor calibration becomes essential. Proper calibration means your sensors are accurately measuring what they’re supposed to, which reduces errors and provides trustworthy information. When sensors are correctly calibrated, the data you collect is precise, making your analysis more reliable. Without calibration, even small inaccuracies can lead to incorrect conclusions, so it’s imperative to regularly check and adjust your sensors to maintain data integrity.
Regular sensor calibration ensures accurate environmental data and reliable climate monitoring.
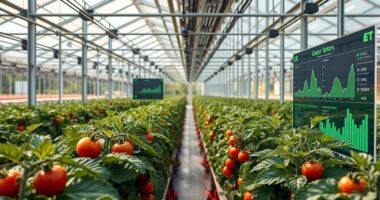
Once your sensors are calibrated, the next step is making sense of the vast amount of information collected. Data visualization plays a key role here. Instead of sifting through endless numbers, you can turn raw data into easy-to-understand charts, graphs, and maps. Visual tools help you quickly spot trends, anomalies, and patterns that might otherwise go unnoticed. For example, a temperature trend line over a week can reveal subtle changes in climate conditions, or a heat map can show areas with higher humidity levels. These visual representations make it easier to interpret data at a glance and support more informed decision-making.
Automated climate data logging systems often come equipped with user-friendly interfaces that facilitate data visualization. You can set up dashboards that update in real time, giving you instant access to current conditions and historical data. This immediacy allows for faster responses, whether it’s adjusting irrigation based on soil moisture levels or issuing weather alerts. Additionally, visualization tools streamline reporting, making it simple to generate detailed reports for stakeholders, researchers, or policy makers.
Moreover, these systems often integrate sensor calibration and data visualization tools seamlessly. When calibration adjustments are needed, you’re notified and can update your sensors directly through the platform. The updated data then reflects immediately in your visual dashboards. This integration ensures your data remains accurate over time, maintaining the quality of your climate monitoring efforts. Additionally, the use of automation technology can further enhance data collection and analysis, reducing manual efforts and increasing consistency.
In short, automated climate data logging combined with effective sensor calibration and data visualization empowers you to monitor environmental conditions accurately and interpret the data efficiently. This synergy enhances your ability to respond to environmental changes proactively, supporting sustainable practices and informed decision-making. Whether you’re managing a farm, conducting research, or overseeing a conservation project, these tools enable you to turn raw data into actionable insights with confidence.
Frequently Asked Questions
How Secure Is the Climate Data During Transmission and Storage?
Your climate data is quite secure during transmission and storage thanks to data encryption, which protects it from unauthorized access. Additionally, strong access controls ensure only authorized personnel can view or modify the data. Regular security updates and monitoring further enhance protection. While no system is completely invulnerable, implementing these measures considerably reduces risks, giving you confidence that your climate data remains safe and confidential.
Can Automated Logs Predict Future Climate Trends Accurately?
Think of automated logs as a compass guiding your climate journey. Machine learning and trend analysis help you map out future climate patterns, but they’re not crystal balls. While they can provide valuable insights, predictions aren’t foolproof due to complex variables. You can trust these tools for informed decisions, but always remember they’re guides, not guarantees, helping you navigate the uncertain waters of climate change.
What Are Common Troubleshooting Steps for Data Logging Errors?
When troubleshooting data logging errors, start by checking your power supply to guarantee consistent voltage and connections. Next, verify sensor calibration to confirm accurate readings. Inspect all cables and connections for damage or looseness. Restart your logging device and update firmware if needed. If issues persist, recalibrate sensors, replace faulty components, and review data logs for irregularities. These steps help maintain reliable climate data collection.
How Do Different Sensors Impact Data Accuracy?
Your sensors can make or break your data accuracy, like a single misstep crashing a skyscraper. Different sensors impact data accuracy through calibration and data resolution; poorly calibrated sensors give skewed results, while low data resolution misses critical details. To guarantee accurate climate data, regularly calibrate your sensors and choose ones with appropriate resolution for your needs. This way, your climate insights stay precise and reliable.
Is There a Standard Format for Climate Data Reporting?
Yes, there are standard formats for climate data reporting, which help guarantee consistency and comparability across datasets. You should follow established data conventions like NetCDF, CSV, or JSON, depending on your needs. Using these standards allows you to share and analyze climate information effectively, reducing errors and improving collaboration with other researchers. Adhering to these formats makes your data more accessible and easier to interpret across different platforms.
Conclusion
By harnessing automated climate data logging, you turn raw numbers into a treasure map of insights, guiding your decisions with precision. This technology acts like a vigilant sentinel, constantly watching over environmental changes without fatigue. As you embrace automation, you’ll find yourself steering through the complex world of climate data with the ease of a skilled sailor navigating through calm waters. Ultimately, this approach transforms data chaos into clarity, empowering you to make informed, impactful choices for the future.