To use data effectively in your greenhouse, start by calibrating sensors regularly to guarantee accurate readings. Use simple visualization tools like charts or dashboards to spot trends and identify issues early. Develop clear data collection routines and document procedures to maintain consistency and reliability. Keep track of key parameters like soil moisture, temperature, and humidity without overcomplicating your setup. If you keep these practical steps in mind, you’ll find managing your greenhouse becomes easier and more efficient.

Get garden gear delivered free — and shop member deals
- Fast, free delivery on millions of items
- Access to Prime Big Deal Days deals on October 6–7
- Prime Video, Amazon Music and more included
Key Takeaways
- Use simple, accessible visualization tools like dashboards to interpret data without technical complexity.
- Regularly calibrate sensors and follow standardized measurement protocols to ensure data accuracy.
- Focus on key parameters (soil moisture, temperature, light) to avoid overwhelming data analysis.
- Develop clear data management practices for consistent collection and documentation.
- Use visual trends and alerts to make quick, informed decisions without deep technical analysis.
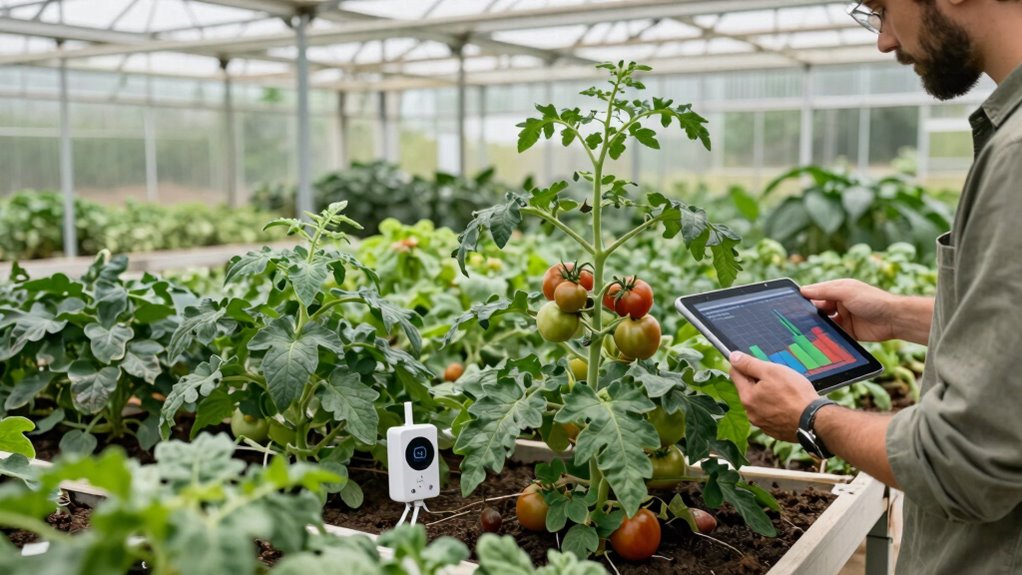
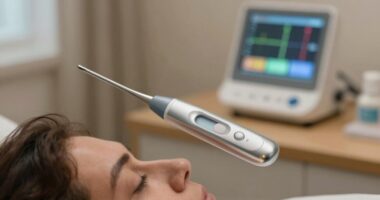
Using data effectively can transform your greenhouse management without turning it into a high-tech lab. You don’t need an elaborate setup to make smarter decisions; simple, well-implemented data practices can dramatically improve plant health and productivity. One of the key aspects is ensuring your sensors are properly calibrated. Sensor calibration is essential because it guarantees that the data you collect reflects real-world conditions accurately. If your sensors are off, even slightly, your decisions could be misguided—leading to overwatering, under-fertilizing, or misjudging temperature needs. Regularly calibrate your sensors according to manufacturer instructions, and check their accuracy periodically. This process of calibration is crucial for maintaining reliable data, which forms the foundation of good greenhouse management. Once your sensors are calibrated, the next step is to make sense of the data through visualization. Data visualization turns raw numbers into clear, understandable visuals—like graphs, charts, or heat maps—that reveal trends and patterns at a glance. Instead of sifting through spreadsheets, you see how temperature fluctuates throughout the day or how humidity levels change in different zones of your greenhouse. This immediate visual feedback helps you identify issues early, so you can act swiftly. For instance, if a heat map shows a certain area consistently runs warmer than others, you can adjust airflow or shading accordingly. Visual tools also make it easier to communicate with team members or stakeholders, as everyone can grasp the current state of conditions without needing technical expertise. You don’t need complex software to start visualizing your data effectively. Many affordable or free platforms offer user-friendly interfaces that integrate with common sensors. Set up dashboards that display key parameters at a glance, focusing on what matters most—soil moisture, temperature, light levels, or humidity. Regularly reviewing these visuals helps you develop a routine, turning data into actionable insights rather than just numbers. Over time, you’ll notice patterns emerging, and you’ll understand how different variables interact, allowing you to optimize conditions more precisely. Incorporating data management best practices will ensure your efforts are sustainable and scalable as your greenhouse grows, and understanding the importance of sensor calibration and data visualization is fundamental to achieving this. Additionally, establishing clear data collection protocols will help maintain consistency across your measurements and improve the overall quality of your data. Proper documentation of your procedures also supports long-term data accuracy, ensuring your data remains reliable over time.
soil moisture sensor for greenhouse
As an affiliate, we earn on qualifying purchases.
As an affiliate, we earn on qualifying purchases.
Frequently Asked Questions
What Are the Best Affordable Data Tools for Small Greenhouses?
You can use affordable data tools like cost-effective sensors that monitor temperature, humidity, and soil moisture easily. Pair these with user-friendly dashboards that display your data clearly, making it simple to track conditions and make informed decisions. Many budget-friendly options are available online, offering reliable insights without the need for complex setups. This way, you stay efficient, save costs, and keep your greenhouse functioning at its best without turning it into a lab.
How Often Should I Collect Data From My Greenhouse?
You should collect data daily or at least several times a week to stay on top of weather patterns and pest monitoring. Regular data collection helps you identify trends and respond quickly to changes, like sudden temperature shifts or pest outbreaks. Consistent monitoring ensures your greenhouse environment remains ideal, preventing issues before they escalate. Use simple tools and automate where possible to make data collection manageable and effective.
Can Data Improve Plant Health Without Complex Analysis?
Data is like a compass guiding your plant growth and pest management efforts. You don’t need complex analysis to see improvements; simple observations, like tracking watering or spotting pest patterns, can make a big difference. By paying attention to these signs, you can adjust conditions early, promoting healthier plants and better pest control. This straightforward approach keeps your greenhouse thriving without overwhelming you with data.
Are There Simple Ways to Visualize Greenhouse Data Effectively?
Yes, you can easily visualize greenhouse data by creating simple charts or graphs on your computer or phone. Focus on strategic sensor placement to guarantee data accuracy; place sensors in key areas like different plant zones and airflow points. Use color coding or trend lines to spot patterns quickly. This approach makes data insights accessible without complex tools, helping you make informed decisions and maintain ideal growing conditions effortlessly.
How Do I Train Staff to Use Data Responsibly?
You train staff by emphasizing data ethics and responsible use. Start with clear staff training sessions that explain why ethical data handling matters, including privacy and accuracy. Encourage open discussions about potential risks and proper data practices. Regularly review procedures, provide resources, and foster a culture of accountability. When staff understand the importance of responsible data use, they’ll make better decisions, ensuring your greenhouse benefits from data insights without ethical concerns.
Conclusion
By embracing simple data collection methods, you can make smarter decisions without turning your greenhouse into a science lab. Keep it practical and focus on what truly matters—monitoring plant health, optimizing resources, and boosting yields. Remember, you don’t need to reinvent the wheel; small, consistent steps can lead to big results. Don’t let the data scare you off—use it as your secret weapon to grow healthier plants and a more productive greenhouse.
Fall yard work Picks
leaf blowers
As an affiliate, we earn on qualifying purchases.